Advanced Analysis
Techniques
Much of the time, risk assessment can be quite straightforward -
just a matter if identifying causes, events, consequences and controls.
But sometimes it's more complicated (and more interesting!).
Here are some techniques which can be employed for more sophisticated risk analysis:
The "Bowtie"
This is a simple and reliable tool to illustrate the multiple causes that may lead to an undesirable event, and the multiple outcomes which may result.
It's also useful to indicate how controls can be used to either prevent the event from occurring, or if it does, mitigating the outcomes.
The bowtie is in wide use throughout various industry sectors.
Here's an example from the rail industry:
For an aviation industry example, here is a link to the bowtie analysis resource from the Australian Civil Aviation Safety Authority (CASA): CASA Bowtie risk analysis
Note, however, that although it is simple, it can at times be simplistic.
Often risks are realised through a combination of factors which interact to produce an undesirable outcome. These may best be modelled through a "fault tree" as shown in the following section below...
Causes Cause Controls Consequence Controls Consequences

"ASB" stands for "Absolute Signal Blocking" - a method of protecting a section of track which excludes rail traffic from a defined portion of track for a specified period.
The Fault Tree
A Fault Tree indicates the logic relationship between various system elements (or causes, more generally) and how they might relate to an overall system failure (or undesirable event).
It can get complicated but the two
key elements in the example shown
are the AND gate and the OR gate.
The diagram shows that:
if 1 OR 2 happen,
OR
if 3 AND 4 AND 5 happen,
OR
if 6 OR (7 AND 8) happen,
then the headline event will happen.
One of the attractions of this method is you can create it in a spreadsheet, and use formulae for the AND and OR gates to work out the probability of the headline event occurring.
It's all on Wikipedia!
It's rather difficult to set up a general pro-forma for this, as every situation is different. But even without the maths, it's a useful exercise to better understand the system or situation you're dealing with.

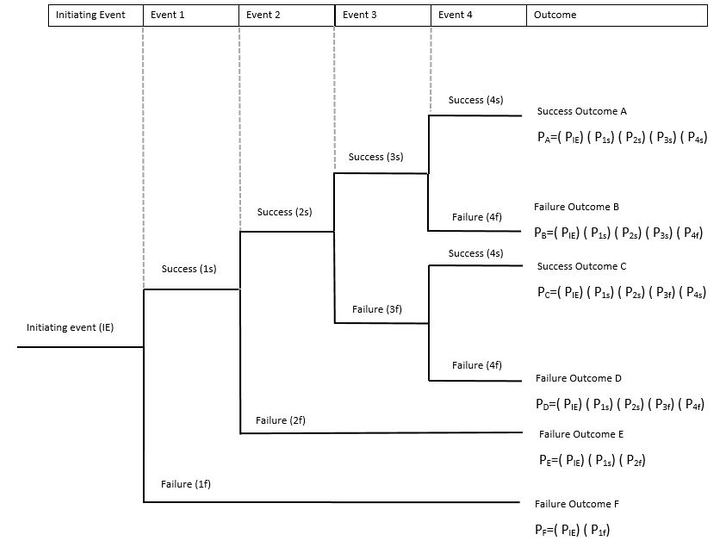
The Event Tree
So...we've worked out the likelihood (or probability) of an undesirable event occurring, but what happens then?
What is the range of outcomes (or "consequences") that might result, and how likely is each outcome?
This is where the event tree is useful in providing a more sophisticated understanding than a simple bowtie.
Once again, there is a wealth of information available on Wikipedia!
The "Cause and Effect" Diagram
In simple terms, this is basically a fault tree, which leads up to the undesirable event, joined up to an event tree, showing all the possible outcomes.
As for the two component elements, these can also be built as a spreadsheet to produce a comprehensive model of the relationships of all the causes which might lead to the undesirable event, and then all then all the potential outcomes.


Here's an example, built in Excel:
Behind the spreadsheet were the formulae for the AND and OR gates to enable modelling of the various elements that might lead to the undesirable condition, and then the range of outcomes that might result.

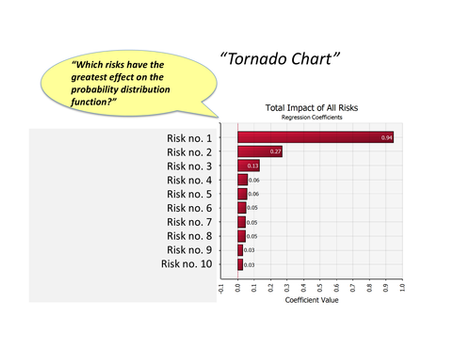
Quantitative Risk Assessment
This is most useful in cases such as construction planning, where we want to consider all the possible risks and determine how much "contingency" we want to provide for.
It's best done using specialist packages [or Excel add-ons] such as Lumivero / Palisade @Risk which do a "Monte Carlo" simulation of all possible options; add them all up in a statistically valid manner and display the answer as a probability density function.
Many years ago, this used to
require an army of consultants
armed with slide rules to do the
required calculations;
now this great software enables it
to be done in seconds (although
it helps to know what you're doing!)